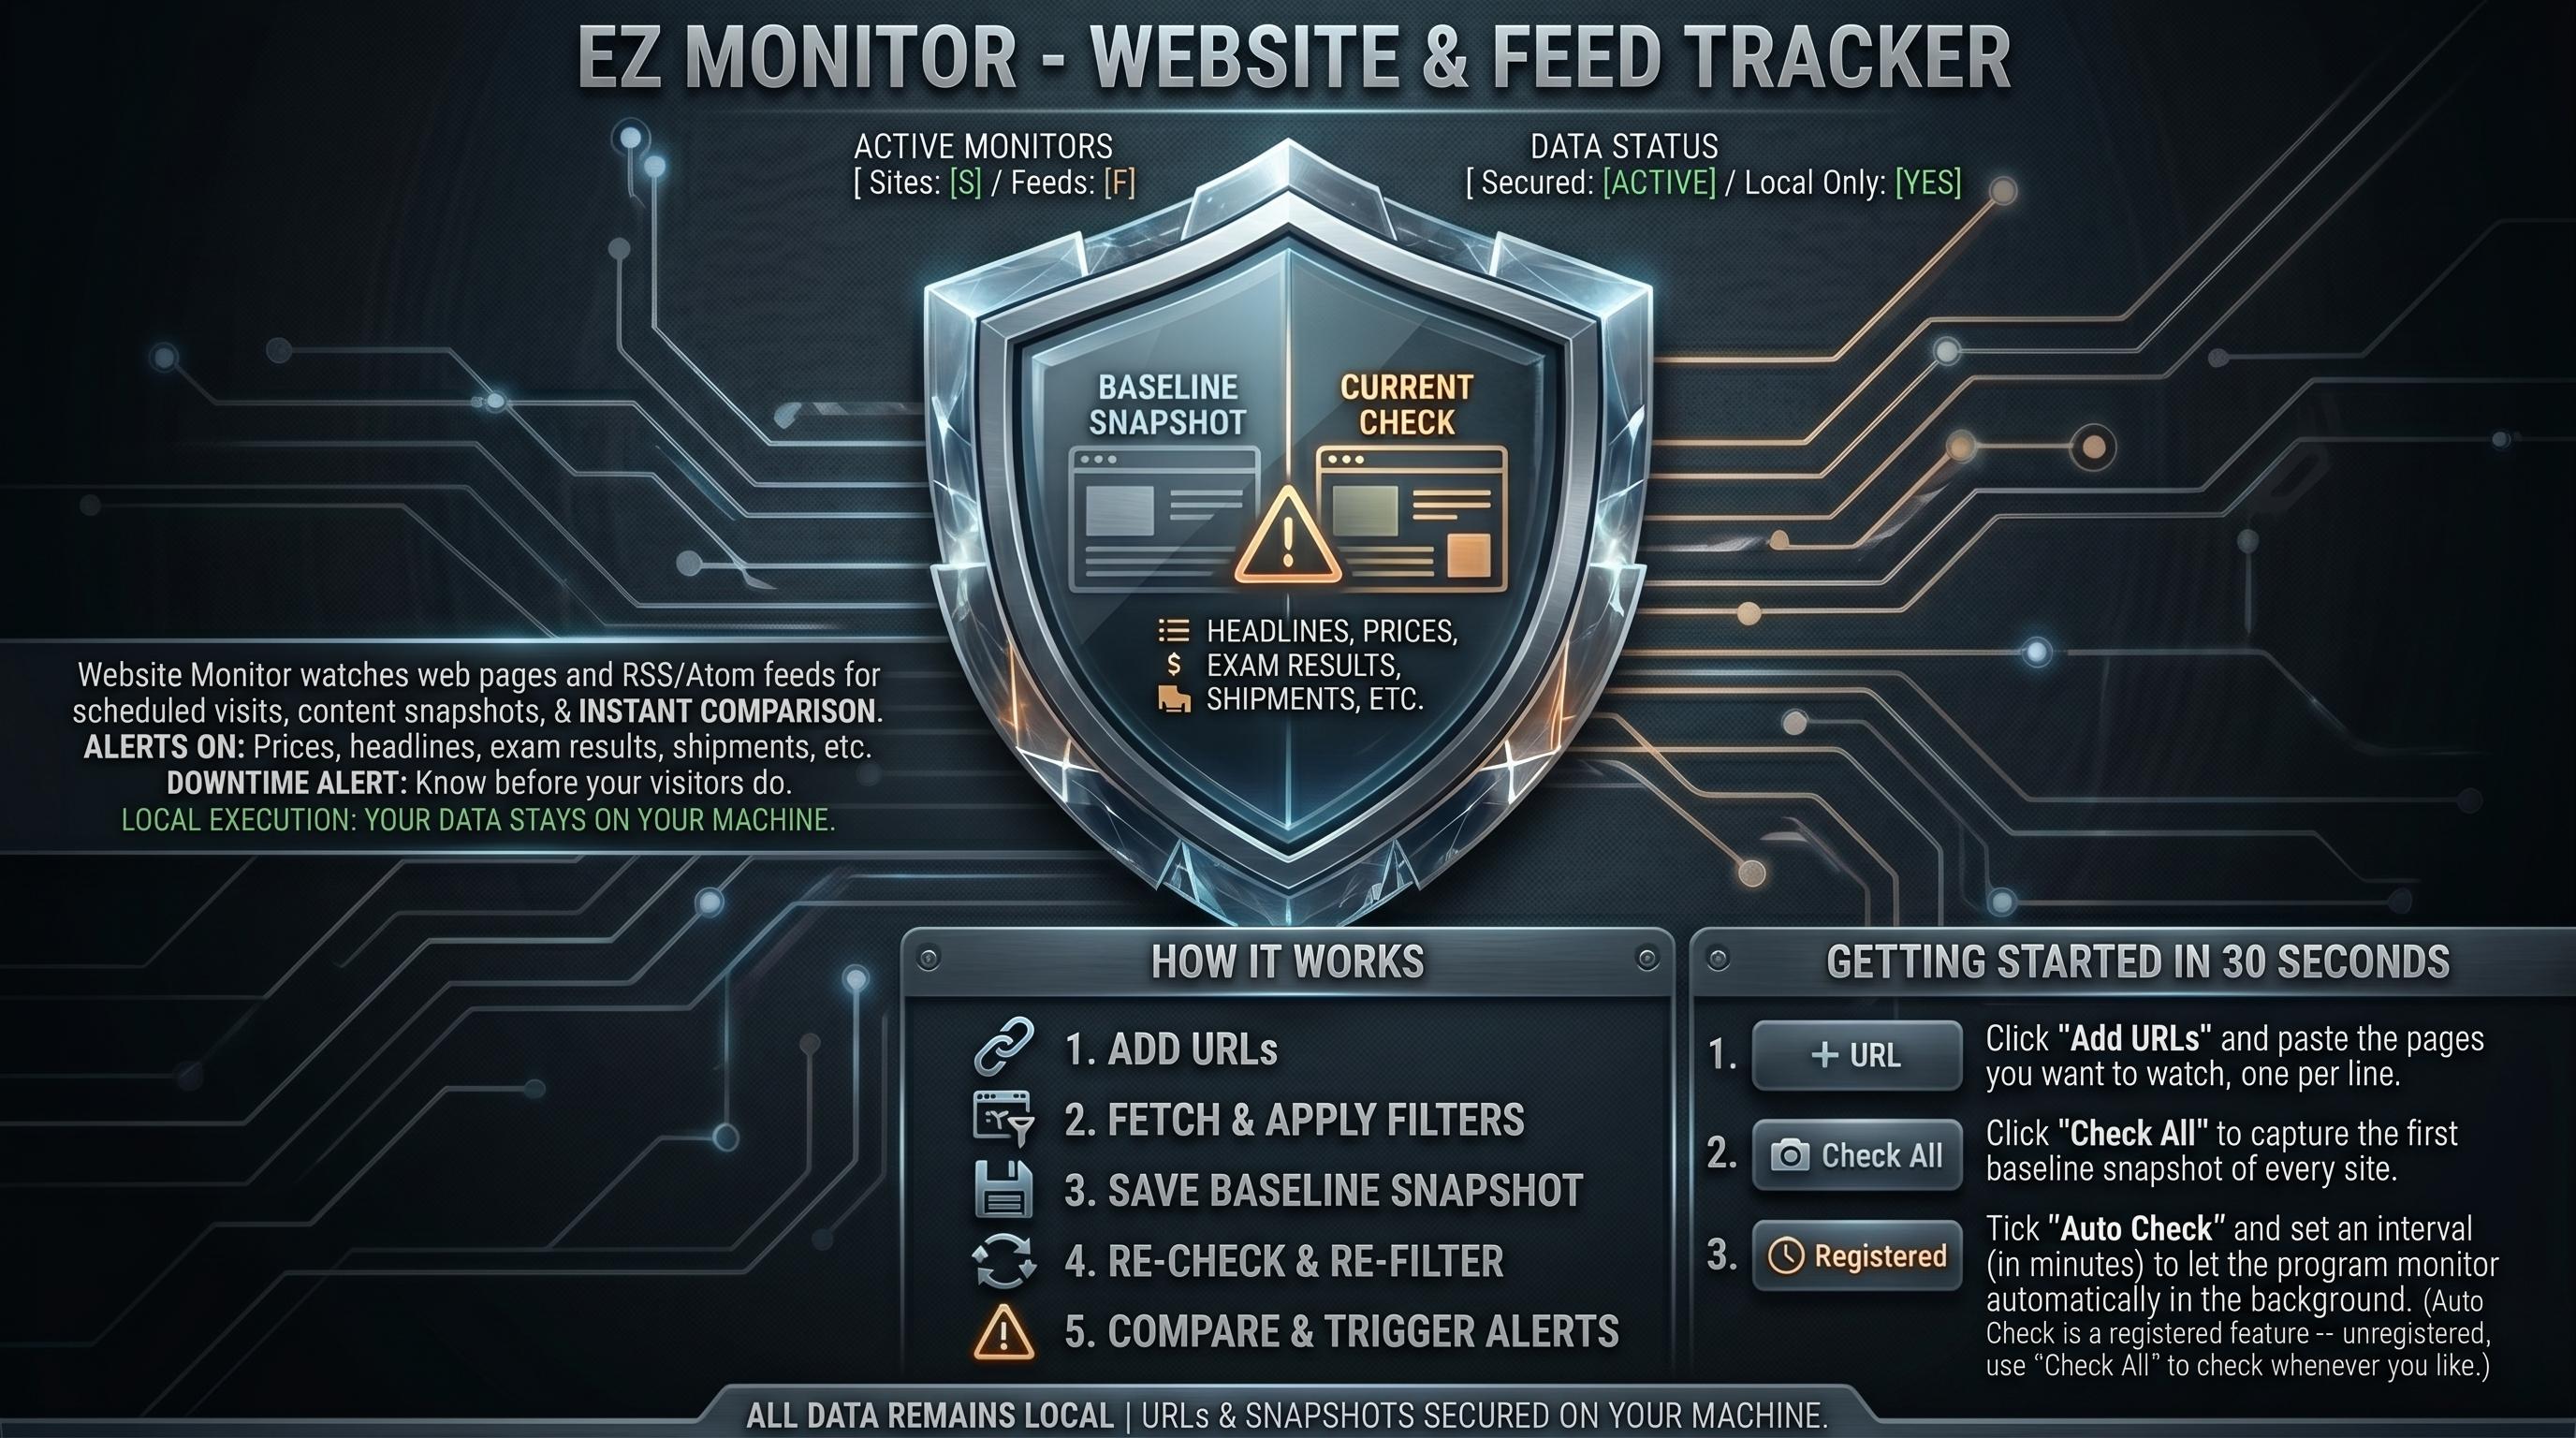
Website Monitor watches web pages and RSS/Atom feeds for you. It
visits each URL on a schedule, saves a snapshot of the content,
and compares it on every later visit. The moment something
changes -- a product back in stock, a new job posting, a
software release, a quietly revised policy page, a concert
going on sale -- it alerts you.
It also tells you when a site goes down or becomes unreachable,
so you find out before your visitors do.
The program runs entirely on your computer. Your URLs and
snapshots never leave your machine.
HOW IT WORKS
------------
1. You add the URLs you want to watch.
2. The program fetches each page and applies your content
filters (optional -- see FILTERS below).
3. The filtered result is saved as the "baseline" snapshot.
4. On every later check it re-fetches, re-filters, and compares
to the baseline.
5. Any difference is flagged as a change and triggers your
chosen alert actions.
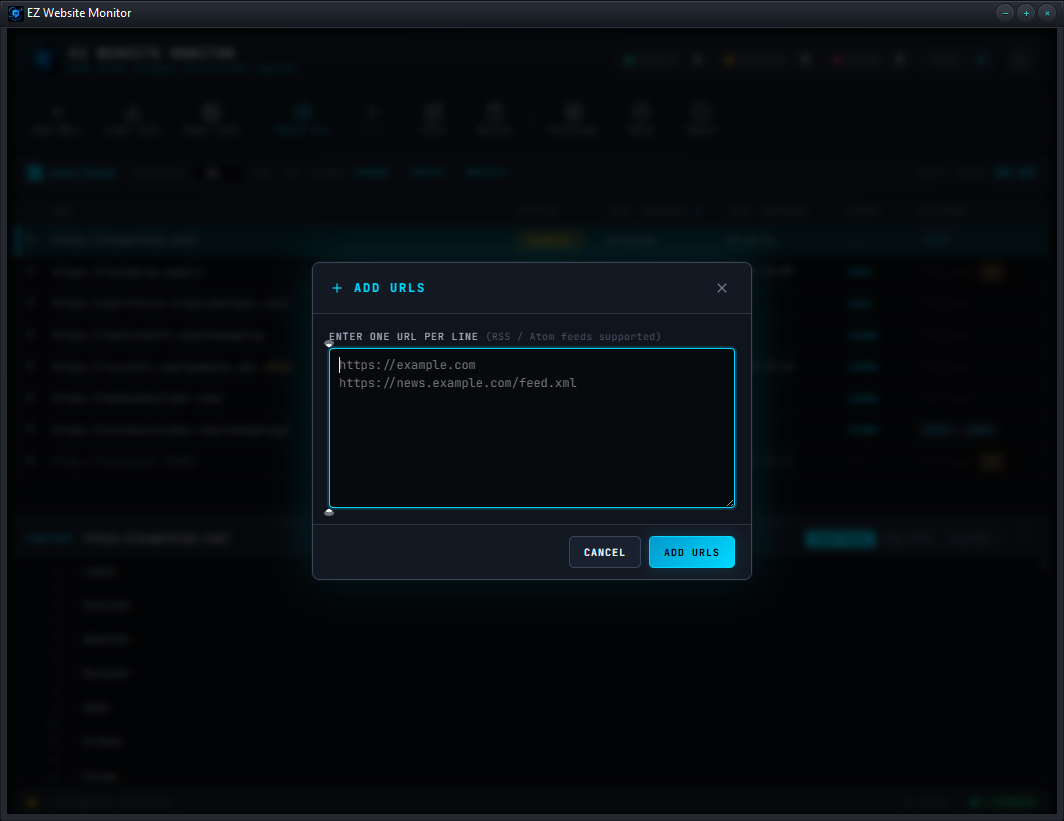
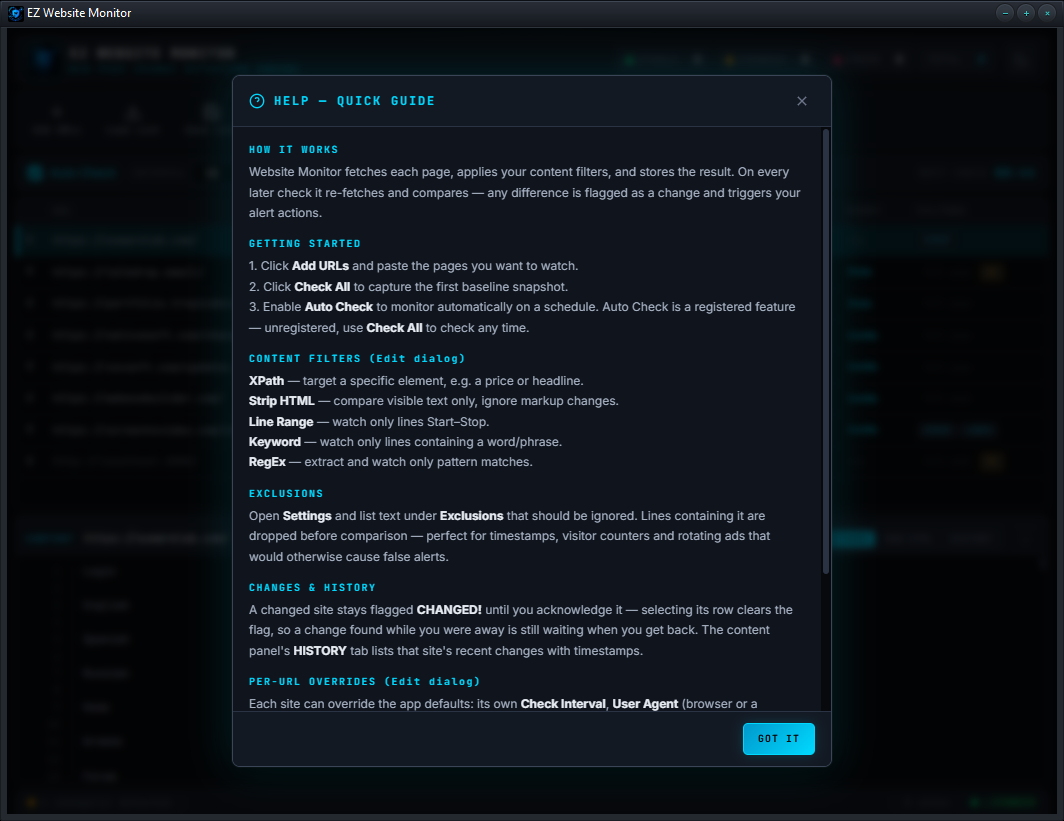
GETTING STARTED IN 30 SECONDS
-----------------------------
1. Click "Add URLs" and paste the pages you want to watch,
one per line. The "https://" prefix is added automatically.
2. Click "Check All" to capture the first baseline snapshot of
every site.
3. Tick "Auto Check" and set an interval (in minutes) to let
the program monitor automatically in the background.
(Auto Check is a registered feature -- unregistered, use
"Check All" to check whenever you like.)
That's it. When a page changes you'll get an alert.
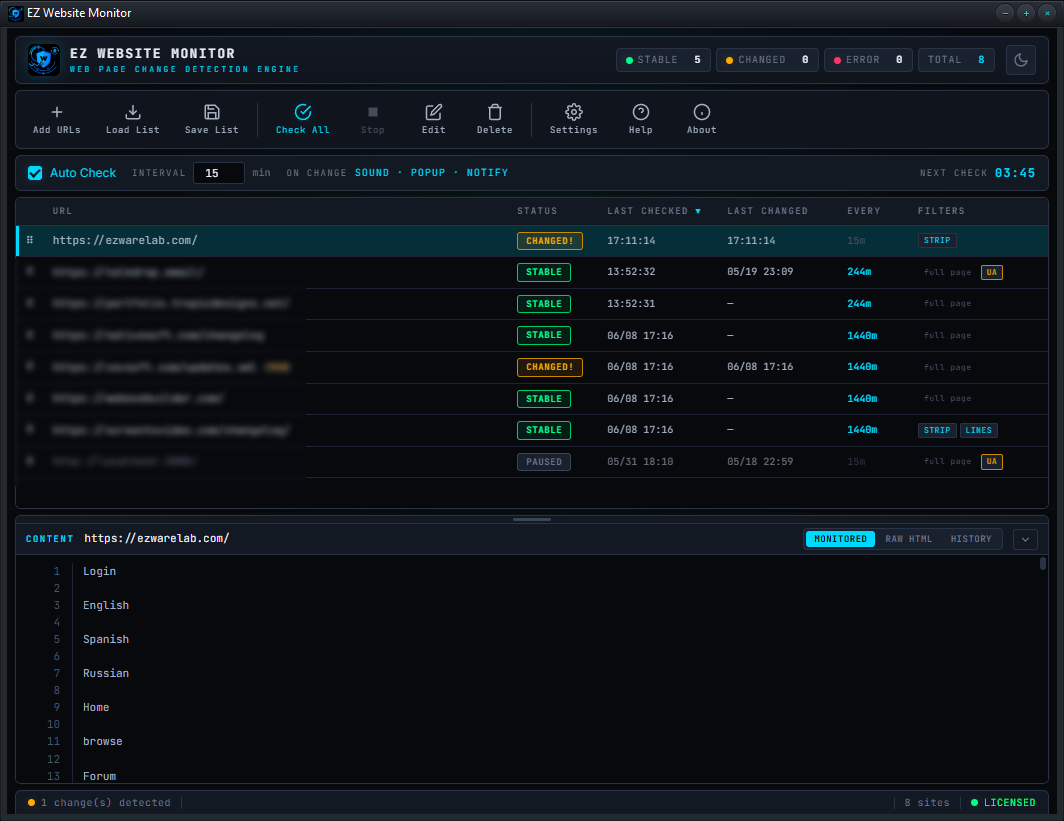
READING THE TABLE
-----------------
Each row shows one monitored site:
(drag handle) Grab this to reorder rows
URL The page being watched (feeds show a FEED tag)
STATUS Colour-coded monitoring state:
NEW Not checked yet
STABLE Checked, no change (green)
CHANGED! Content changed (amber)
ERROR Site unreachable (red)
CHECKING Check in progress (cyan)
CHANGED! is "sticky" -- once a change is found
the row stays flagged until you acknowledge it,
even through later quiet checks (see below).
LAST CHECKED When the site was last visited
LAST CHANGED When a change was last detected
EVERY This site's check interval
FILTERS Which content filters are active. An amber UA
chip marks a custom user agent; a green ALERTS
chip marks custom per-site alert actions
The header pills (STABLE / CHANGED / ERROR / TOTAL) keep a
running tally.
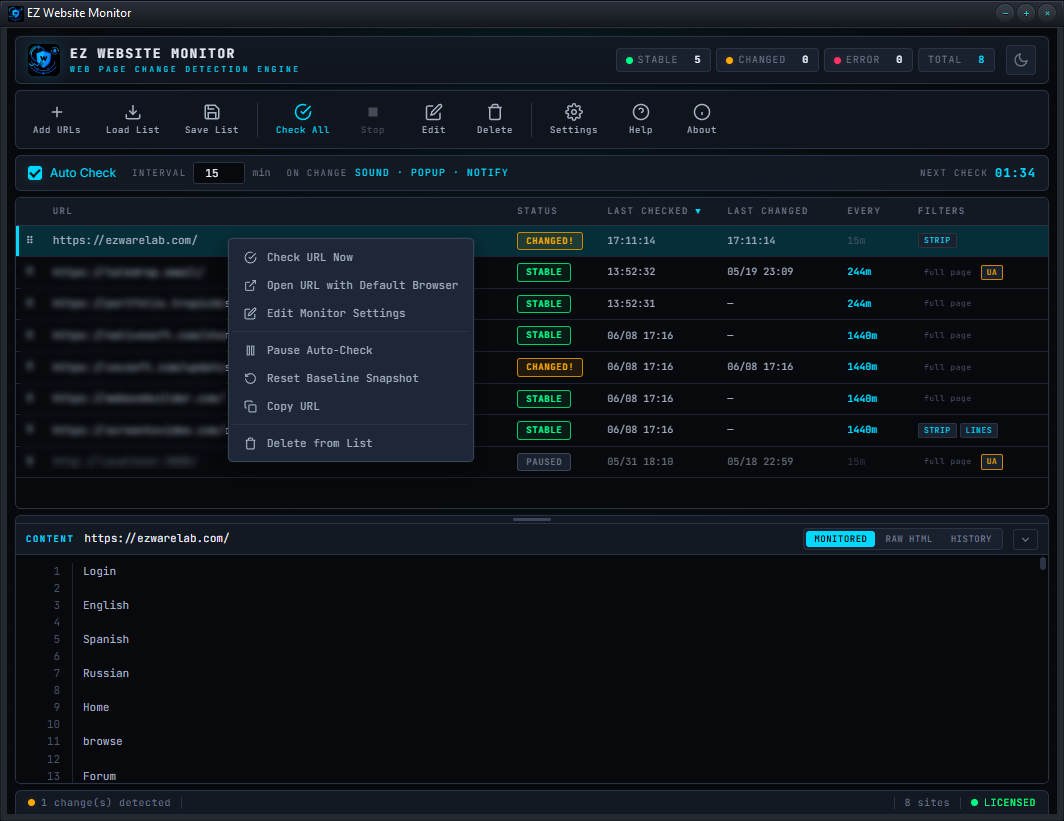
CLICKING ROWS
-------------
SINGLE-CLICK Select the row; its content shows in the viewer
DOUBLE-CLICK Open the URL in your default browser
RIGHT-CLICK Popup menu with these actions:
- Check URL Now
- Open URL with Default Browser
- Edit Monitor Settings
- Reset Baseline Snapshot
- Copy URL
- Delete from List
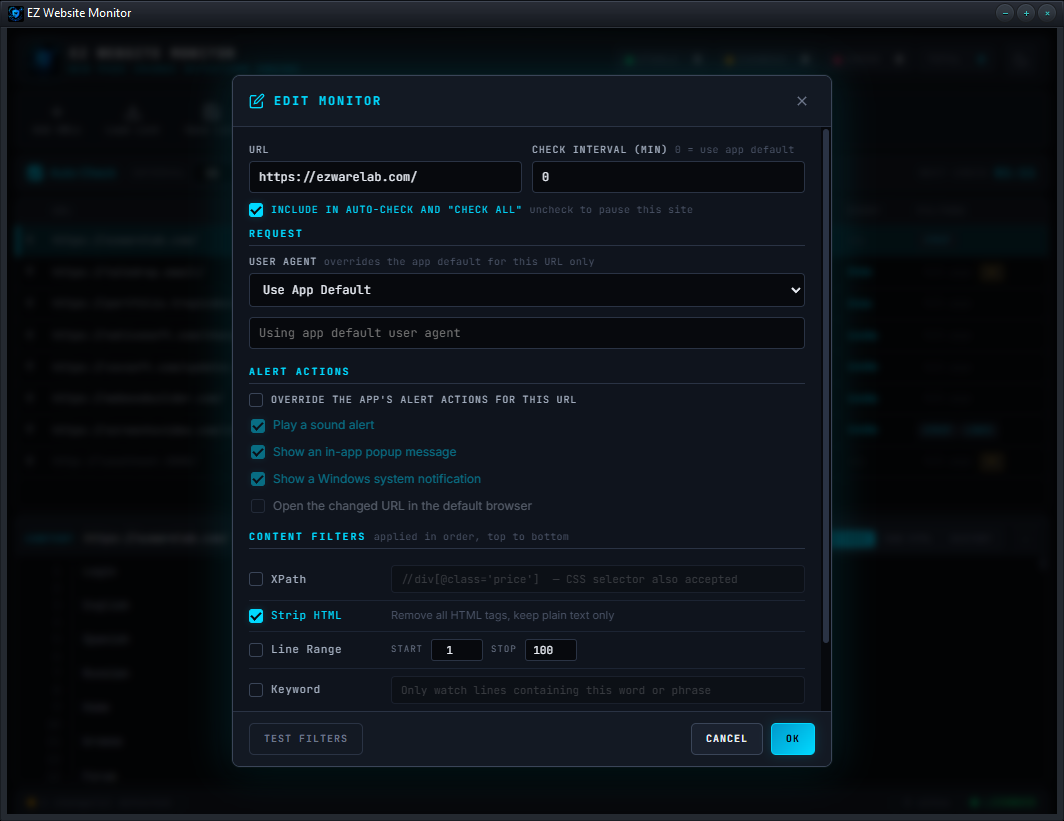
CONTENT FILTERS (Edit dialog)
-----------------------------
Filters let you watch only the part of a page that matters, so
unrelated changes don't trigger false alerts. Open a site's
Edit dialog and enable any combination. They apply in order:
XPath Target specific HTML/XML elements -- e.g. just a
price box or a headline. A CSS selector works
here too (e.g. div.price).
Strip HTML Remove all HTML tags and keep only the visible
text. Ignores markup-only changes.
Line Range Watch only lines Start..Stop of the content.
Keyword Watch only lines containing a specific word or
phrase you define.
RegEx Apply a pattern and watch only the matches --
ideal for dates, prices, IDs, tracking numbers.
Changing a site's filters resets its baseline, because the old
snapshot is no longer comparable. Re-check to recapture it.
Use the "TEST FILTERS" button in the Edit dialog to preview
exactly what the filters produce before saving.
PER-URL CHECK INTERVAL
----------------------
Every site can have its own check interval that overrides the
app default. In the Edit dialog set "Check Interval (min)":
0 Use the app default interval
any number Check this site every N minutes instead
The EVERY column shows each site's effective interval -- dim
text means it's using the default, bright cyan means a custom
override. The "Next Check" countdown shows the soonest site
due.
PER-URL USER AGENT
------------------
Each site can also use its own user agent, overriding the app
default. In the Edit dialog, under "REQUEST", choose:
Use App Default Use the agent set in Settings
Chrome / Firefox / Edge / Googlebot A built-in preset
Custom... Type any user agent string
This helps when one site must be fetched as a search-engine
crawler, or only responds correctly to a particular browser.
Sites with a custom agent show an amber UA chip in the FILTERS
column -- hover it to see the full string.
Changing a site's user agent resets its baseline, since a
different agent can return different content.
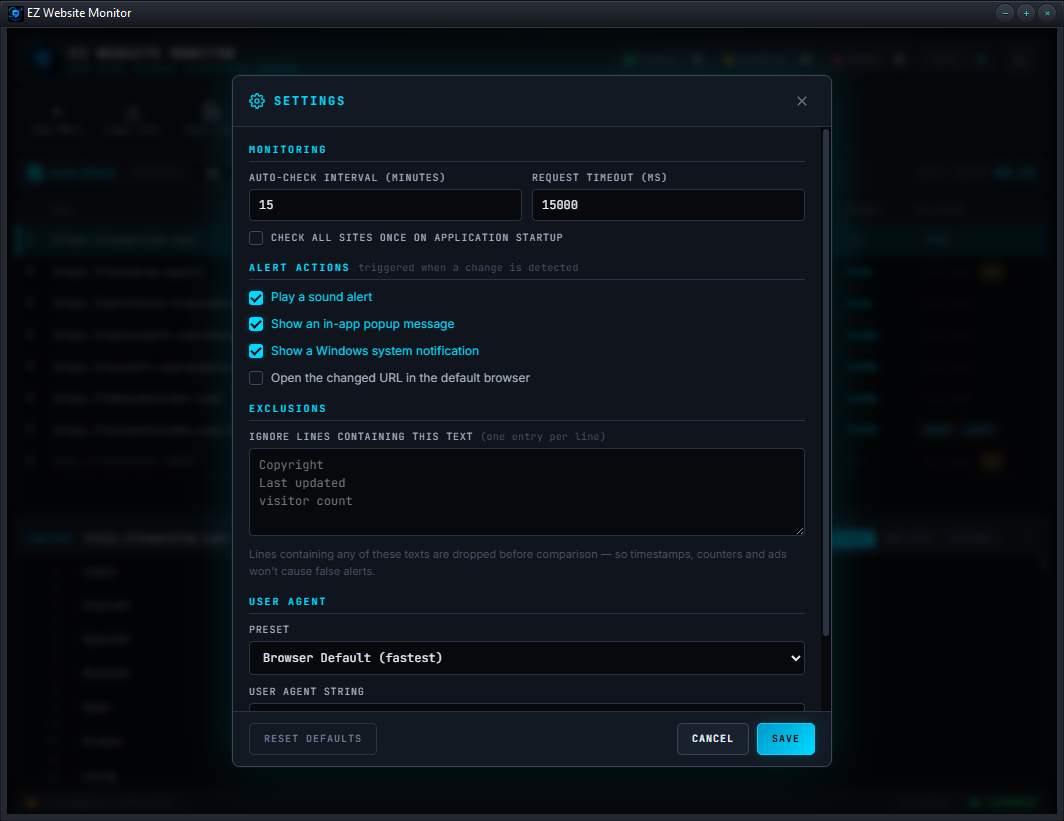
EXCLUSIONS
----------
Exclusions filter out lines that change often but don't matter
-- timestamps, visitor counters, rotating ads, "last updated"
notices.
Open Settings (or the Settings > Exclusions menu) and list any
text that should be ignored, one entry per line. Any line on a
monitored page containing that text is dropped before the
comparison -- so it can never cause a false alert.
ALERT ACTIONS
-------------
When a change is detected, the program can:
Sound alert A two-tone chime
In-app popup A window listing what changed
System notification A Windows toast notification
Open URL Opens the changed page in your browser
Toggle these in Settings > Alert Actions. The active actions
are shown in the "On change" area of the toolbar sub-bar.
AUTO CHECK (registered feature)
--------------------------------
Tick the "Auto Check" box to monitor automatically. Each site
is checked on its own interval (custom or default). The program
keeps running the schedule in the background -- including while
minimized to the system tray -- and the "Next Check" countdown
shows when the next check fires.
Auto Check is available in the registered version. Unregistered,
the box shows a "Register to Enable" lock and checking is manual
only (see UNREGISTERED VS REGISTERED below). Manual "Check All"
and per-site "Check URL Now" always work, registered or not.
Auto Check state, intervals, and all settings are remembered
between sessions.
THE CONTENT VIEWER
------------------
The lower panel previews the selected site. It has three tabs:
MONITORED The filtered content actually being compared.
Changed lines are highlighted in amber.
RAW HTML The full unfiltered page source from the last
check.
HISTORY A timeline of this site's recent changes -- each
entry shows when it changed and how many lines
differed (the last 30 are kept).
Drag the grip bar at the top of the panel to resize it. Click
the chevron button to collapse or expand it. Both the size and
state are remembered.
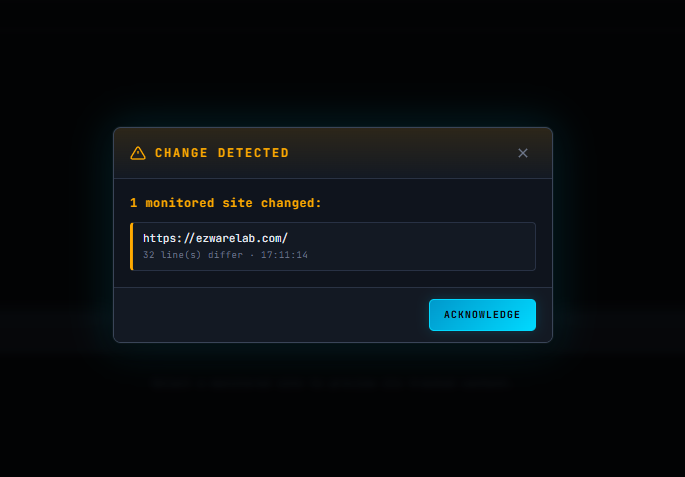
STICKY CHANGE FLAGS
-------------------
When a change is detected, the site is flagged CHANGED! and
stays that way until YOU acknowledge it -- it will not be
cleared by later checks that find nothing new. This means a
change that happens while you are away from the PC is still
waiting for you, in plain sight, when you return -- even if
the app or computer restarted in the meantime.
A site is acknowledged (the flag clears) when you:
- select its row to view it, or
- click "Acknowledge" in the change popup, or
- reset its baseline snapshot.
The header CHANGED pill counts unacknowledged changes, so it
is a reliable "what did I miss" tally.
WHEN A CHECK FAILS
------------------
If a site can't be reached it is marked ERROR. Select that row
and the content viewer shows a full connection-error report:
- The URL, the failure reason, and when it was last checked
- Which fetch backend produced the error
- A plain-language hint explaining the most likely cause
(timeout, DNS failure, server error, dropped connection...)
- FAILURE HISTORY -- a log of the last 20 failures with
timestamps and backend, so you can tell a one-off blip
from a site that is genuinely down
Every check uses a fast direct fetch first; if that fails, the
program automatically retries that URL through a PowerShell
request, which reports a precise error message into the log.
FILE / TOOLBAR ACTIONS
----------------------
Add URLs Paste one or more URLs to start monitoring
Load List Import a saved monitor list
Save List Export your monitor list to a file
Check All Check every site right now
Stop Abort a check in progress
Edit Edit the selected site's URL, interval, user
agent and content filters
Delete Remove the selected site
Settings Open the settings dialog
Help Show the quick guide
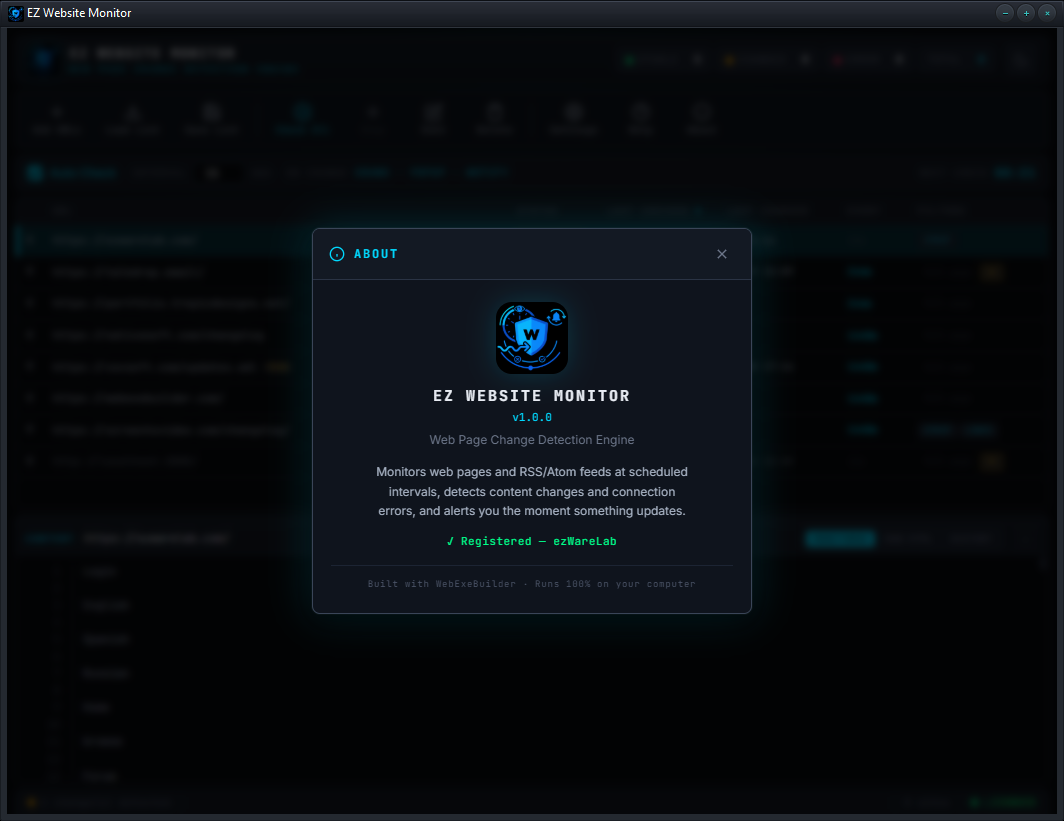
About Version and license information
Save List writes a JSON file that preserves each URL's check
interval, user agent and content filters. Load List accepts
that JSON, and also plain text lists (one URL per line) for
compatibility.
SETTINGS
--------
MONITORING
Auto-Check Interval Default minutes between checks
Request Timeout How long to wait for a response
Check on startup Check all sites when the app opens
ALERT ACTIONS
Choose which actions fire when a change is detected.
EXCLUSIONS
Text to ignore during comparison (see EXCLUSIONS above).
USER AGENT
The default user agent for every site. Choose a browser
preset or enter a custom string. Individual sites can
override this in their Edit dialog -- see PER-URL USER
AGENT above.
KEYBOARD SHORTCUTS
------------------
F5 / Ctrl + R Check all sites now
Delete Remove the selected site
Esc Close any open dialog / menu
THE STATUS BAR (BOTTOM)
-----------------------
Left Current state -- Ready, Checking, change/error counts
Middle The URL currently being checked
Right Site count, and your license status
(green LICENSED, or amber UNREGISTERED)
Click the license indicator to open the About dialog.
UNREGISTERED VS REGISTERED
--------------------------
The unregistered version is fully functional with no site
limit -- monitor as many URLs as you like. Every feature is
available EXCEPT one: Auto Check.
Unregistered Unlimited sites. Manual checking only --
"Check All" and per-site "Check URL Now".
All filters, alerts, history and exports work.
Registered Everything above, PLUS Auto Check -- automatic
background monitoring on a schedule.
While unregistered, the Auto Check box shows a "Register to
Enable" lock; clicking it (or trying to tick the box) opens
the registration dialog.
To register:
1. Click the UNREGISTERED indicator at the bottom right,
the Auto Check lock, or open About from the toolbar.
2. Click "Register".
3. Enter your registration details.
4. The app updates immediately -- Auto Check unlocks with
no restart needed.
TIPS AND TRICKS
---------------
* For a price or stock watch, use an XPath or CSS selector to
target just that element -- you'll get an alert only when
that specific value changes.
* For a noisy page, turn on Strip HTML and add Exclusions for
any line that updates on every visit.
* Give fast-moving pages a short custom interval and slow ones
a long one -- no need to check everything at the same rate.
* Right-click a site and choose "Reset Baseline Snapshot" to
start fresh -- e.g. after you've reviewed a change and want
the current state to become the new baseline.
* Use "TEST FILTERS" in the Edit dialog to see exactly what
will be compared before you commit.
* If a site behaves differently for crawlers, give it the
Googlebot user agent in its Edit dialog -- or a specific
browser agent if it only serves content to one browser.
* When a site keeps erroring, select it and read the FAILURE
HISTORY -- repeated identical errors mean a real problem,
scattered one-offs mean transient network glitches.
* Save List regularly to back up your monitor configuration,
or to move it to another computer.
TROUBLESHOOTING
---------------
"A site always shows CHANGED after every check"
Something on the page updates constantly. Add the changing
text to Exclusions, or use a tighter filter (XPath / Keyword)
to watch only the part you care about.
"A site shows ERROR but it works in my browser"
Select the row to read the connection-error report and its
hint. Give that site a different User Agent in its Edit
dialog -- some servers block or vary by agent. Check the
FAILURE HISTORY to see whether it's a one-off or persistent.
"A site shows 'Failed to fetch'"
A deliberately vague browser error -- it is NOT a CORS issue.
It means a genuine network or server fault: a transient
connection drop, the server resetting the connection, rate-
limiting after repeated checks, or a DNS hiccup. The program
auto-retries the URL via PowerShell, which records the precise
reason in the FAILURE HISTORY log. If a URL that worked before
starts failing, a temporary network or server glitch is the
most likely cause.
"Auto Check isn't firing"
Make sure the Auto Check box is ticked and the interval is
set. The "Next Check" countdown shows the next scheduled run.
v1.0.0.0 - Initial Release
Your review goes here
1.00
Jun 11, 2026 - 02:04 PM
Jun 09, 2026 - 04:31 PM
Windows


No Reviews